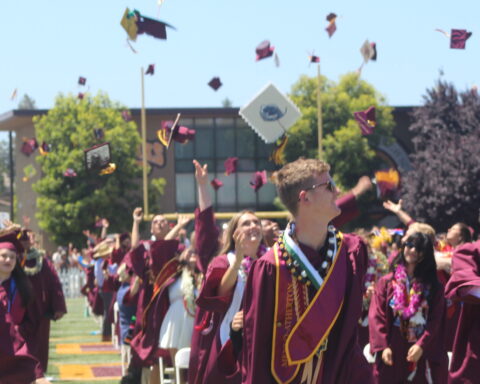
Photo credit to Rubin Abdi
Many M-A Seniors are among over 2 million current high school seniors who faced months of stress navigating the college applications rite of passage. It culminated in a season of rejections, waitlists, and acceptances. But how do the statistics from the 2022-23 application cycle compare to prior cycles?
Overall Surge in Applications
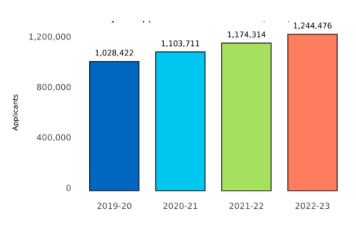
Based on key findings released recently by the Common App, there was an overall surge in the 2022-23 cycle. 1,244,476 distinct first-year applicants applied to 841 participating member colleges this cycle. This represents a 21% increase from the 2019-20 application cycle and an approximate 6% increase in applicants from last year. Since the 2019-20 cycle, the total number of applications in the 2022-23 cycle increased by 30%, and the number of applications per applicant increased by 8%.
Slight Drop in UC Applications
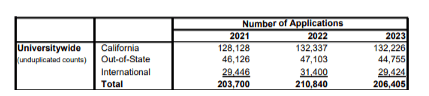
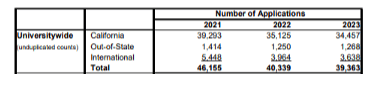
In contrast, the University of California, one of the largest university systems in the country, reported that they received 245,768 distinct applications for admission for fall 2023, a 2.2% decrease from fall 2022, in which they received 251,179 applications. This includes 206,405 applications for freshman admission and 39,363 transfer applications.
Impacts of Test-Optional Schools, 3 years later
In the 2020-21 school year, Common App reported that as a result of the COVID-19 pandemic, the number of their member schools requiring standardized test scores decreased from 55% to 5%. Likewise, they published that the test score reporting rate dropped from 74% during the 2019-20 school year to 40% in the 2020-21 school year. Over the last 2 school years, it seemed to have stabilized at around 43%.
More Diversity in Applicant Pool
On a bright note, the applicant pool diversified and access for underrepresented students increased. Underrepresented Minority (URM) and first-generation applicants are increasing at faster rates—31% and 36% from 2019 to 2023, respectively—than their non-URM and continuing-generation counterparts—14% over the same period. Students reporting eligibility for a Common App fee waiver also increased at over four times the rate of students not reporting fee waiver eligibility—49% compared to 11%.
Freshman Enrollment Stabilizing after Pandemic Declines
The National Student Clearinghouse Research Center reports that fall 2022 undergraduate enrollment in the US was 94,000 students, which is an increase of 4.3% from fall 2021. Since fall 2019, around when COVID-19 first hit the U.S., total undergraduate enrollment has declined around 6%.